Pathfinding Algorithm Visualizer
View on Github ~~>Description
This project is an interactive visualization of several pathfinding algorithms in JavaScript. The pathfinding algorithms included are:
- A* (A-Star) - A best-first search algorithm that uses heuristics to find the shortest path efficiently
- Dijkstra’s Algorithm - A classic algorithm that guarantees the shortest path by exploring all nodes systematically
- Breadth-First Search (BFS) - A level-by-level exploration algorithm that guarantees the shortest path in unweighted graphs
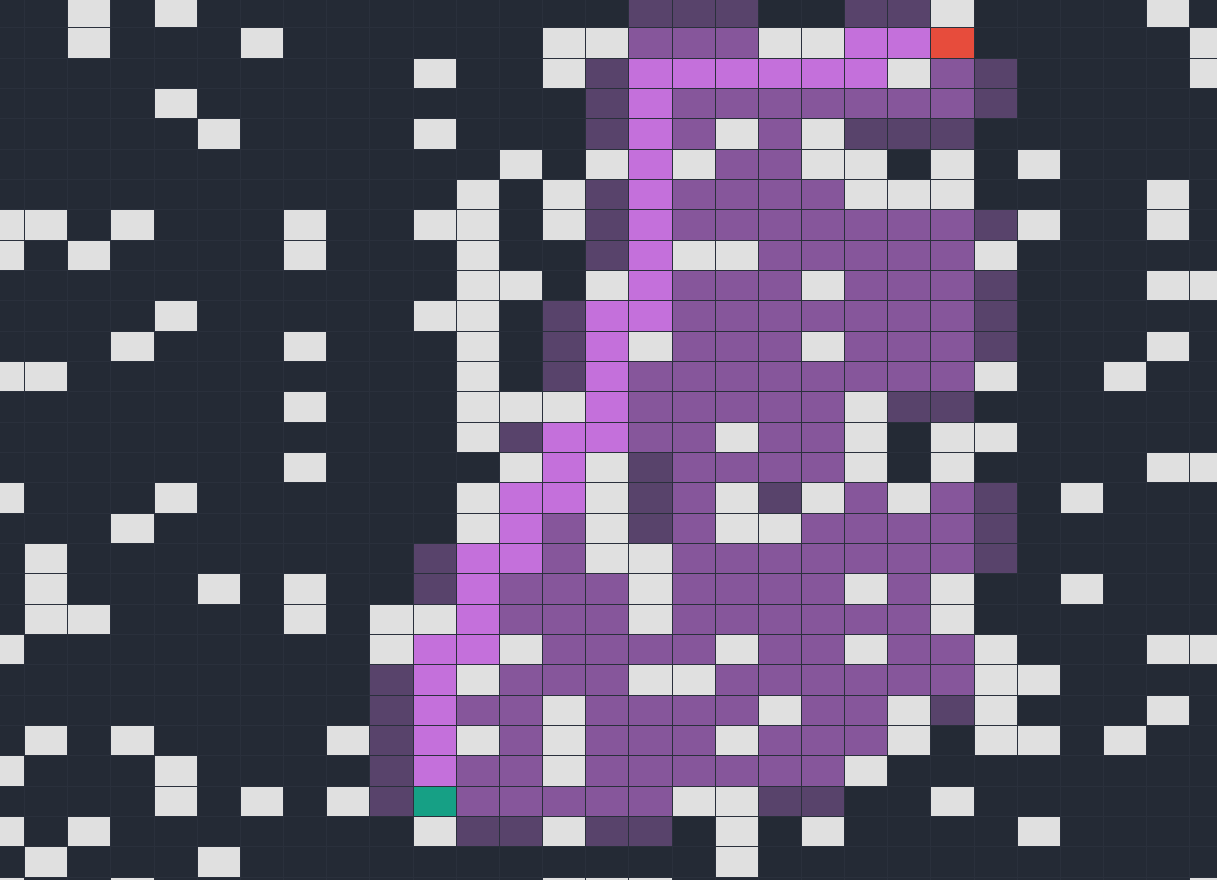
The visualization features an interactive grid where you can place start and end points, draw walls, and watch the algorithms explore the space in real-time. The demo uses visual indicators to show:
- Ghost cells (light purple) - Nodes in the queue waiting to be explored
- Explored cells (medium purple) - Nodes that have been visited and evaluated
- Path cells (bright purple) - The final shortest path discovered
You can also randomize the grid to generate challenging mazes with guaranteed solvable paths, adjust the visualization speed, and track performance metrics including nodes explored, path length, and execution time.
Live Demo
The live demo is available to try out. It provides an interactive grid-based interface to visualize pathfinding algorithms in action. You can:
- Click and drag to place start points, end points, and walls
- Switch between drawing modes using the button controls
- Randomize the grid to create interesting maze patterns
- Adjust the visualization speed and grid size
- Compare different algorithms and their exploration strategies
Be sure to set your start and end points before running an algorithm. The metrics panel will show you how many nodes were explored and the length of the path found.